


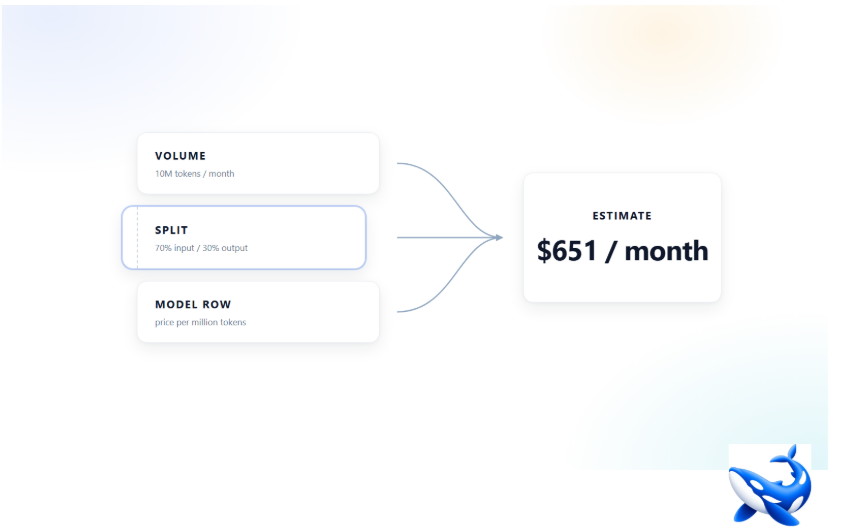
Ten million tokens a month, split seventy per cent input to thirty per cent output, priced on a row that charges $21.00 per million input tokens and $168.00 per million output tokens: the bill comes to $651 [VENDOR, read 2026-10-14]. Three of those four numbers were chosen before you arrived. The volume and the split are the defaults on an AI gateway page’s cost calculator, and the row is the one it starts on — which the OpenAI API page supplies. Only the choice of row is left to the reader, and the two preset inputs are the two that no real workload is obliged to respect.
That is not a complaint about the estimate. It is an answer to one precise question — what does ten million tokens a month cost when seven tenths of it is input — and a reader who never checks the split is reading a number generated for somebody else’s workload. The useful move is not to distrust the figure but to price the same volume at three or four different splits and see how wide the band turns out to be.
What the calculator actually asks
Read the widget as a form rather than as an answer. It takes a monthly token volume, a proportion of that volume billed as input rather than output, and a model row from the pricing table. Multiply the volume by the split, apply the row’s two rates, and you have the monthly figure. Nothing in that chain is a measurement of anything you have done.
The page states the rates are the provider’s published ones and that no markup is added, so the estimate is what the same workload would cost called direct [VENDOR, read 2026-10-14]. That is worth having, because it makes the number portable: it is not a discounted figure that only applies inside one product. What it is not is a prediction. An estimate is only as good as its inputs, and here two inputs arrived preset.
Three inputs, one of which you have to guess
The model row is the input nobody struggles with, because the page puts twenty-three of them in a table with both rates printed beside each name. The volume is guessable once you convert it: ten million tokens is roughly seven and a half million words at three quarters of a word per token, which is a lot of text and also a completely ordinary month for a team running a support assistant.
The split is the input that decides the answer and the input that almost nobody has measured. Take a support exchange of a five-hundred-word question and a fifteen-hundred-word answer — about 2,700 tokens all told. Ten million tokens a month is roughly 3,700 of those. Now look at what the exchange is actually made of: 667 tokens going in and 2,000 coming out, so a twenty-five-seventy-five split, not seventy-thirty. The default is not merely imprecise for that workload. It is pointing the wrong way.
The arithmetic at the default, and one step to the side
Run the numbers at the preset and then step off it. The calculator’s own row carries an input rate of $21.00 and an output rate of $168.00 per million tokens [VENDOR, read 2026-10-14], and it holds a quality score of 10 out of 10 on OrcaRouter’s own composite — our measure, assembled from production traffic and published sources, not a third-party benchmark.
At ten million tokens a month, the four splits work out like this:
| Split (input / output) | Monthly cost |
| 90 / 10 | $357 |
| 70 / 30 (the default) | $651 |
| 50 / 50 | $945 |
| 30 / 70 | $1,239 |
The default sits in the middle of a band that spans a factor of about three and a half, and every point in that band uses the same catalogue, the same row and the same volume. Only the assumption changed. A team that reads $651 and budgets $651 has budgeted for a workload it may not have, and the error is symmetric — the same page’s arithmetic can overstate the bill for an extraction job just as easily as it understates it for a drafting one.
Why the split is a property of your workload, not the vendor’s
The multiplier that decides how much the split matters is printed in the same table: the ratio of the output rate to the input rate. On the row above that ratio is eight to one, which is why stepping from 70/30 to 50/50 raises the bill by about forty-five per cent. A cheaper row with a gentler multiplier behaves differently — one small row is priced at $0.100 in and $0.500 out, a ratio of five to one, and the same step moves its total by about thirty-six per cent [VENDOR, read 2026-10-14].
Two conclusions follow. The first is that the split is a property of your workload and has nothing to do with which provider sells you the tokens. Summarisation is nearly all input; generation can be nearly all output; an agent that reads a large context and emits a short decision sits at the far input-heavy end and is cheap to run almost regardless of the row. The second is that a row’s headline price is not enough to pick it. Two rows with identical input rates but different multipliers rank differently at every split except the one where they happen to coincide.
Where the estimate stops being useful
Three things fall outside a calculator of this shape, and all three push the real bill below the estimate rather than above it. The first is caching: a workload that repeats a long, unchanged prefix can be billed for that prefix at a fraction of the input rate, which shrinks the input term that the default already exaggerates.
The second is that not every row is billed per token. The catalogue carries rows charged per request, and they appear in the pricing table with a rate that no per-million arithmetic can consume — a model priced by the call has a monthly cost that depends on how many calls you make, not on how long they are. Reading such a row’s cell as zero is a mistake; reading it as free tokens is a larger one.
The third is volume drift. A monthly estimate assumes a month that looks like the month you described, and usage that grows thirty per cent a quarter is not a rounding error over a year. None of the three argues against using the estimate. It argues for reading it as a starting point whose two fixed inputs are the two worth revisiting first.
The takeaway
Take the published figure, then take apart the two inputs that were set for you. Ten million tokens a month is a plausible volume and seventy-thirty is one split among many; at the same volume the bill runs from $357 to $1,239 across four splits, and the row’s own output-to-input ratio decides how fast it moves. Estimate your own split before you estimate anything else — a support exchange with a long answer is output-heavy whether or not the calculator’s default says so — and check the output rate separately from the input rate, because that second number is where the estimate turns into a bill.
Sourcing note: the calculator’s default volume, default split, selected row and $651 monthly figure, and every per-million-token rate cited, are vendor-published and read 2026-10-14 [VENDOR]; the three alternative splits and their monthly totals are arithmetic performed on those published rates, not separate measurements. The quality score cited is OrcaRouter’s own composite, not a third-party benchmark. The caching and zero-markup descriptions are the vendor’s own published account of its product, read 2026-10-14 [OURS].
